“Time is a four letter word” – Time Considerations in Failure Analysis

Here’s a challenge for you. What is the definition of time? I’ll give you time to look it up. I recommend using Meriam Webster’s definition. If I were to cut and paste the definition into this blog, it would exceed my word limit. It’s amazing to think that such a small word can have so many definitions and applications.
Having been fortunate enough to live after Einstein’s era, I had the opportunity to study this little word in its many forms. An interesting concept that Einstein taught us is that time is not a universal measurement. Regardless of what you might think, time is not absolute. The rate at which time passes for any individual is dependent on their speed and acceleration at any given moment. Yes, time is dependent on physical conditions, and I would argue resources and motivation.
As an electrical engineer providing services in failure analysis, root cause analysis, scope of damage, time to repair, and business interruptions, I can’t get away from having to explain time elements. During discussions with clients, I am often confronted with determining the following:
· how long did it take to fail
· how long should it take to fail
· how long did it take to repair
· how long will it take to repair
· how long should it take to repair
· was this a sudden failure
· did the incident manifest over time
· is this the result of normal wear and tear
· what is the expected life of the equipment
My initial response to these concerns is typically met with frustration. My response on many occasions has been …… “It depends.” After all, as we discussed above, time is dependent. Does this mean there is no answer or am I being evasive? Certainly not, there is an answer. It may require obtaining some background information, but there is an answer.
One of the more common failures I deal with concerns underground conductors. It almost always seems the failure occurs for no apparent reason. No unusual singular event, power outage, or voltage anomaly occurred, yet we have a failure. We almost always want to tie the failure to a specific moment in time, when sometimes the failure mechanism existed many years before the catastrophic failure occurred. One of the failure mechanisms for underground conductors is called partial discharge, which will be discussed in another blog. Or in some cases, the failure occurred as the result of reaching the wear-out point, or end of useful life.
So why do some failures occur sooner than others? Well, that depends (here we go again). We have to consider physical conditions, application, design, and installation. We can calculate mean time to failure (MTTF) for certain conditions to understand the expected life of the underground conductors. This will help identify if the failure event is normal, exceeding the expected life, or if other factors resulted in a premature failure. For underground conductors, proper design and environment play a significant role in the MTTF.
Remember, nothing lasts forever. Expected life is another term we consider in applying our MTTF analysis. We can plot the life cycle of equipment and the plot would look something like a bathtub, thus we call it the bathtub curve[1].
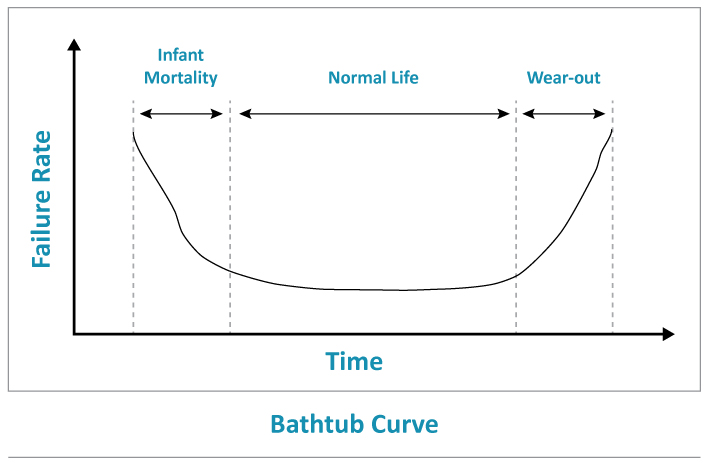
Notice the axes of measure; Failure Rate versus Time. Note that the rate is a function of time. This curve represents the decreasing failure rate after run-in (infant mortality), normal useful life (expected life), and wear-out. As the time of service increases, the curve remains flat until the end of the expected life where there is an exponential rise in the probability of failure.
The three stages of the curve are dependent on many variables. If equipment is manufactured, installed, and maintained properly, the expected life can be extended. The expected useful life may be shortened if there is a manufacturing defect, the installation is not done properly, maintenance is not performed, or if environmental conditions are harsh or hazardous. With enough information, the probability of failure can be calculated with reasonable accuracy.
Another example of applying this analysis occurs when examining compressor motors in heating ventilation and air conditioning (HVAC) units. When verifying the condition of the motor windings at the time of installation, the insulation resistance (IR) values are most always ideal. Over time, and during normal operation, the insulation of the conductors in the motor windings will begin to degrade. When the winding insulation resistances are measured after several years, the values are less than ideal. This does not mean the equipment has failed, it simply means it is plotting (or plodding) along its useful life curve into the wear-out phase. It will eventually fail if it continues to operate for an extended period of time. On multiple occasions, winding insulation resistance results are presented as out of tolerance, and therefore related to an incident that occurred at a specific moment in time ie., as the result of a voltage surge. Depending on the vintage (age), operations, and maintenance, the out of tolerance values may be expected as the result of normal operation over time.
So why would I say resources and motivation may affect time. I have seen two similar repairs take considerably different times to repair. Damage to a 3,000 Ampere (A) electrical bus occurred one afternoon in an industrial manufacturing facility. The damage was repaired in less than 24 hours. A similar event occurred in a second facility and took weeks to repair. The type and scope of damage in each facility was very similar. The repairs were virtually identical. So why the difference in repair time? Motivation and Resources.
Given proper resources, a repair can be completed in short order. The cost to keep the plant down in the first facility was far greater than the second. Downtime was extremely expensive, so measures were implemented to respond quickly and effectively. Parts were identified, sourced, and delivered due to preparations for such an incident. Internal resources were able to provide labor. Good planning and available funding allowed the repair to be conducted properly and expeditiously. The incurred cost to the facility was minimized due to preparation and quick response.
In the second facility, sourcing and internal resources were not available. The facility depended on outside contractors to source parts and labor. The facility was operating at limited capacity and the downtime was not as critical. A temporary repair was implemented in 24 hours and the long-term repair was completed many weeks later with a second shut-down. Even with the incurred cost of the temporary power and a second shut-down, the impact and cost to the facility was minimized due to an efficient and proper repair plan. Had they proceeded with the repair as the previously mentioned facility, the cost to repair would have been cost-prohibitive and potentially shut down the operation permanently.
Time is perceived by an observer, and all observers have a different perspective. It is our job to understand the perspective of the observer to make the best use of time.
[1] www.geeksforgeeks.org/short-note-on-bathtub-curve/
About the Author
Tony Catalfomo, M.S.E.E., P.E. is a Consulting Engineer in our Charlotte, NC Office. Mr. Catalfomo provides consultation in the areas of electrical engineering, with an emphasis in industrial power distribution and controls including electrical failure analysis, damage assessment, and repair/replacement analysis. You may contact him for your forensic engineering needs at tcatalfomo@edtengineers.com or (704) 523-2520.
Learn about how EDT Forensic Engineering & Consulting approaches scope of damage, and forensic engineering by assigning a file today.