Fractures (Part 2)

As noted in our previous blog, Fractures Part I, our Scanning Electron Microscope (SEM) is capable of 100,000X magnification, allowing a close-up look at material surfaces for defects, inclusions, and fracture characteristics. In addition, the SEM includes Energy Dispersive Spectroscopy (EDS) which uses x-ray technology to determine material composition (atomic elements). In effect, you can zoom in on very small areas and see what’s there and determine the type of material used in making the part.
By using a SEM/EDS to study the surface of a fracture, the question of how the part broke - or the mode of fracture - can be answered. Was the part pulled apart, sheared, twisted or bent? Once this is established, a review of the history of the breakage or failure may assist in answering the questions: Why did it break? or What was the cause?
The four principle fracture modes are: dimple rupture, cleavage, fatigue, and decohesive rupture.
Dimple rupture is caused by a common process known as microvoid coalescence. As the part is being pulled apart, the ductile material (think salt water taffy) creates tiny bubbles (microvoid coalescence) in the material. When the part fractures into two sections the tiny bubbles break leaving cuplike depressions. The cuplike depressions are referred to as dimples. As such, dimple ruptures are most often associated with ductile fractures.
Cleavage is a low-energy type of fracture that displays matched faces, flat and featureless surfaces that are most often associated with brittle breaks. The best way to visualize this type of fracture mode is to think of a thick chocolate bar that is broken in half. The amount of energy and effort to break the chocolate bar is low (i.e., low energy; featuring little to no deformation of the fractured material) and the brittle fractures are smooth, flat, and look alike when compared to each other.
Fatigue fractures are associated with repetitive and/or cyclic loading. The best way to visualize this fracture mode is to bend a paperclip back and forth until it breaks. As the paperclip is bent back and forth, the paperclip is subjected to three stages. Stage I: the start of the break or crack initiation, Stage II: the growth of the break or crack propagation, and Stage III: the final breakage of the paperclip into two sections or catastrophic fracture.
Decohesive rupture is a fracture associated with a reactive environment (i.e., being subjected to hydrogen, sulfur, phosphorus, chlorides, etc.) and the fracture propagates along/across grain boundaries. In other words, the part breaks due to the corrosive environment in which it is used. The fracture occurs along the molecular grain boundaries of the material and requires high magnification to view.
For the second part of our discussion of fractures, a fatigue fracture surface was examined to illustrate the characteristics associated with the fatigue fracture mode.
Fatigue fractures resemble brittle fractures, in that they take place with little deformation of material. Fatigue fractures often take place as the result of thousands of load cycles and have a number of distinct features that allow them to be identified.
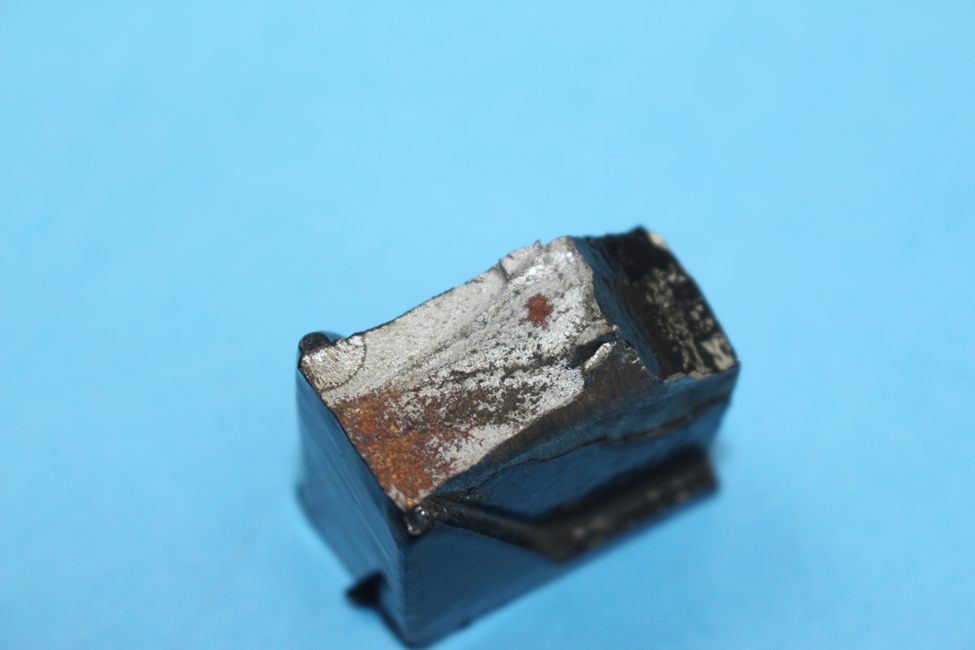
The particular sample we’re looking at here was harvested from the tongue of a failed trailer hitch, near the point where the trailer ball is attached. If you’ve ever hooked a trailer up to your car or truck, you’re probably familiar with trailer hitches and can see how a part like this would experience thousands of load cycles. This is not counting the times you ran into it with your shins, but rather the loads generated by the weight of the trailer as it traveled down the road, taking off and stopping, traveling over the bumps and undulations in the road, etc.
While some of our sample’s features are identifiable without magnification, others were only observable under high magnification.
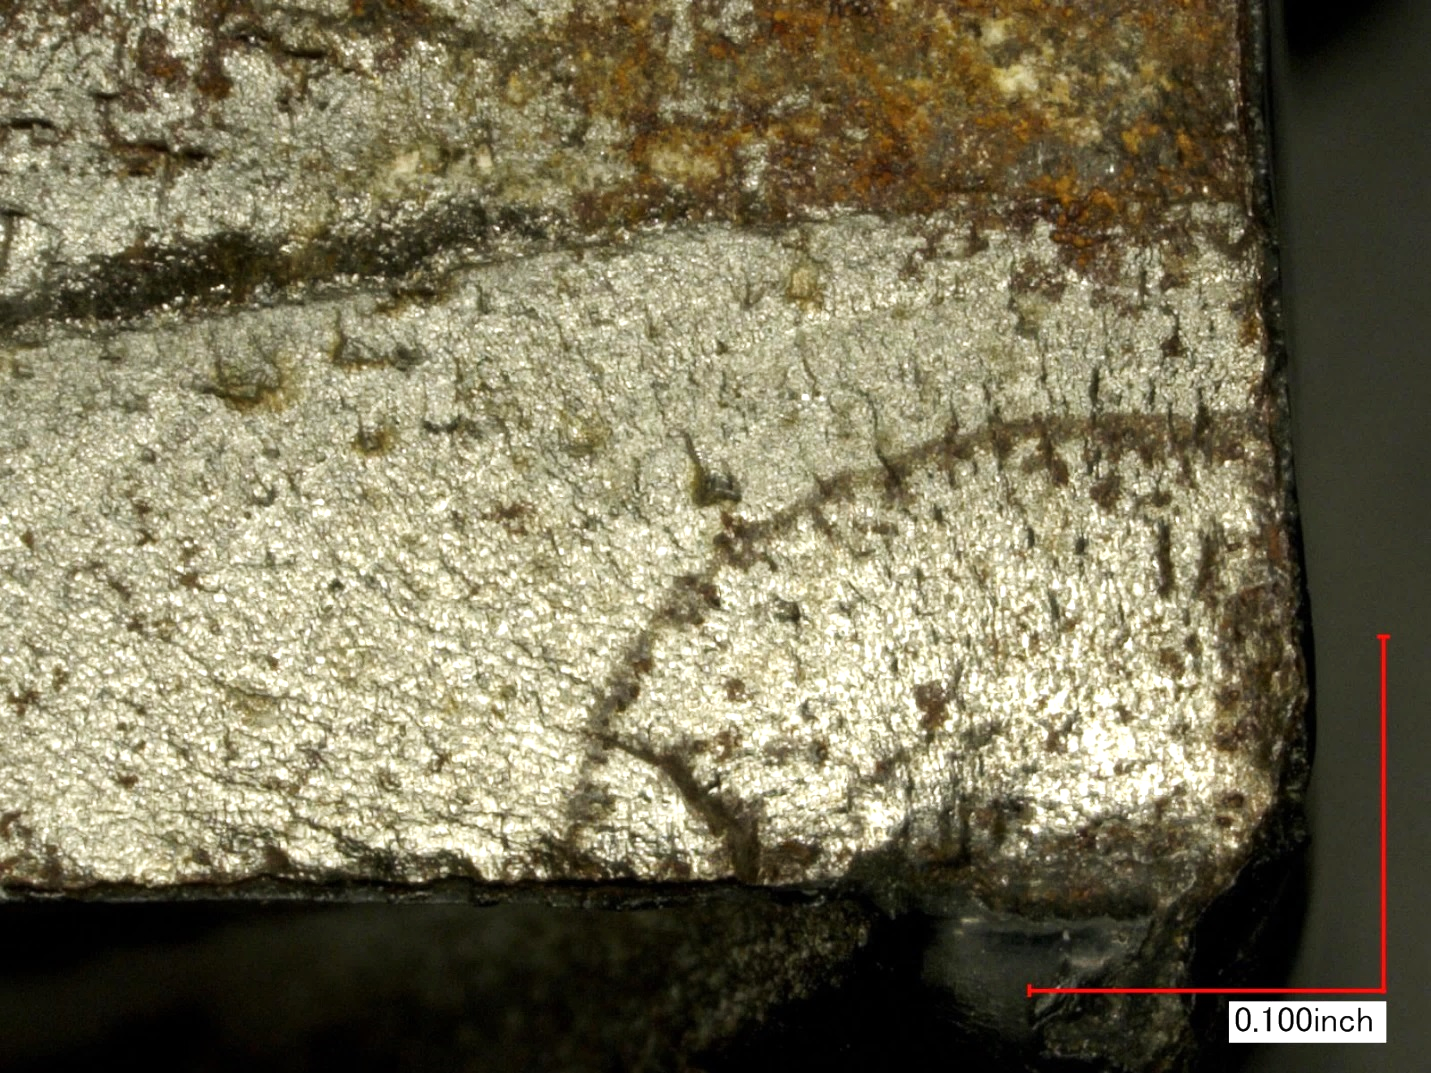
Examination without magnification found the part to contain a series of arcs starting at the corner (see figure 1, upper left corner of part or figure 2, lower right corner), increasing in size as they advance across the fracture surface. The area formed by these arcs (often referred to as “beach” marks) indicate sites where cracking came to a temporary stop when loading dropped below a damaging level then resumed when the damaging load was reapplied. The smooth area of the fracture containing these arcs forms the fatigue fracture surface. Beyond the smooth fatigue surface, a more textured area (resembling the overloaded bolts we examined for our previous blog post) is observable. This rough area shows us where the final overload failure of the part took place. Other visual indication of fatigue fracture is observable at the lower right corner of figure 2, where a dark, rust-colored arc is observable. This rusting is typical of fatigue fractures of iron and steel parts since the fatigue fracture often exposes unprotected material to the elements for an extended period of time before the final failure of a part takes place. The shinier spots on the fatigue fracture surface also clue us in to this being a fatigue fracture as they show us where raised portions of the mating fracture surfaces were flattened by repeated contact after the initial fracture event.
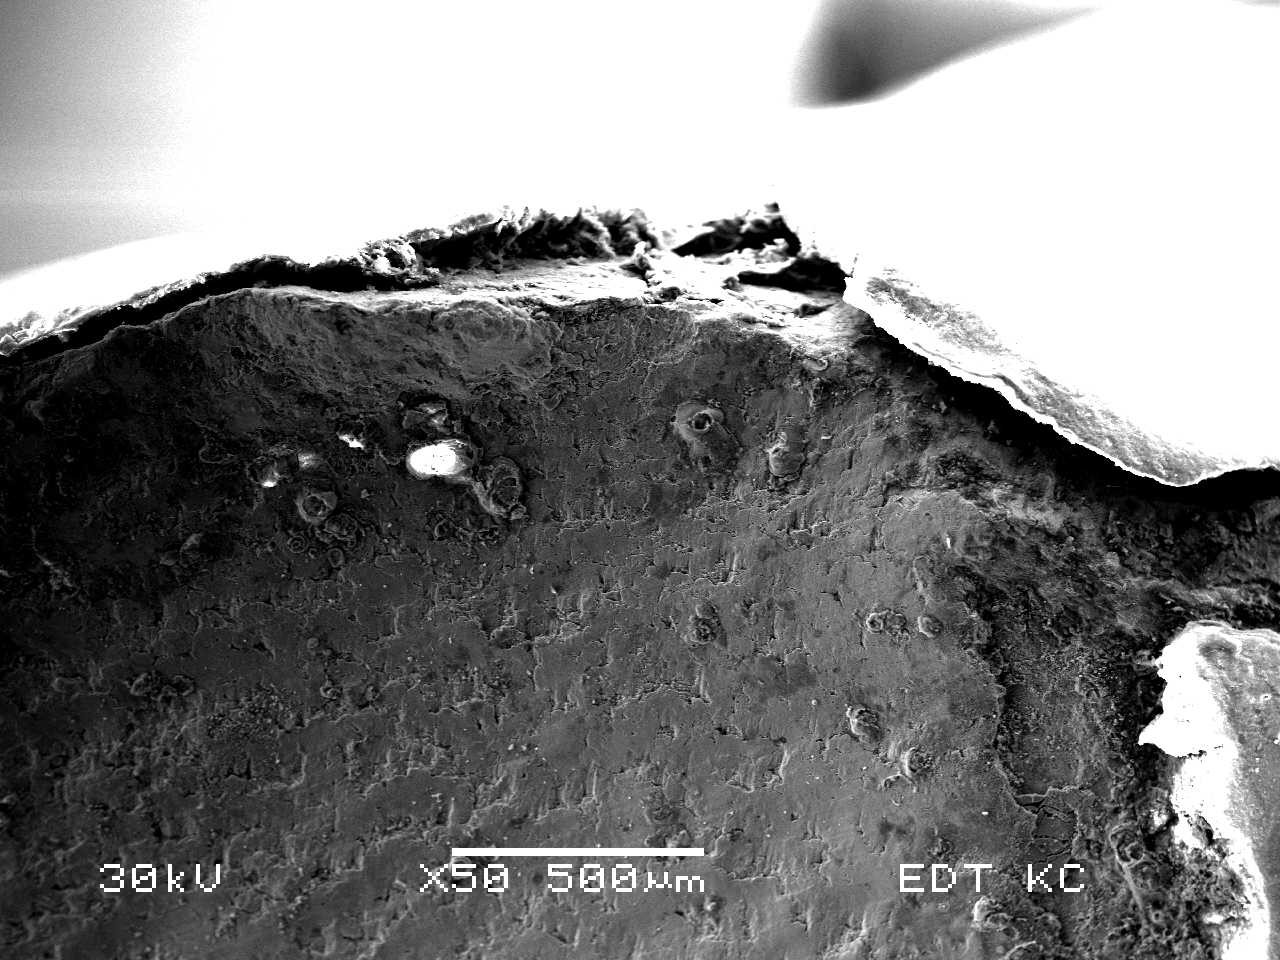
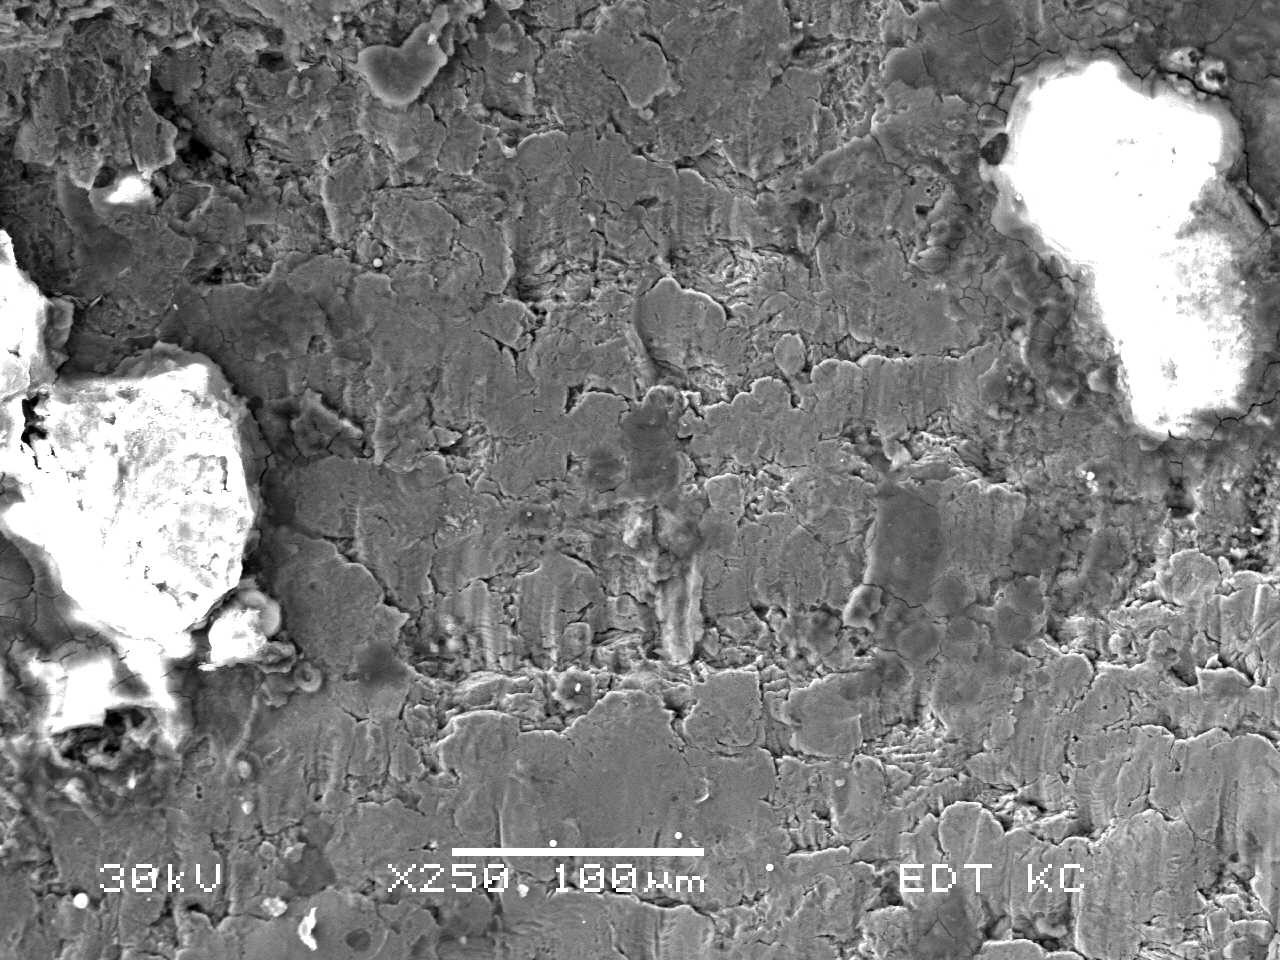
While looking at these shiny spots in the SEM at 50x magnification doesn’t tell us the whole story (figure 3), increasing magnification to 250x provides confirmation of this contact as the flattening of the contacting areas is readily observable (see figure 4).
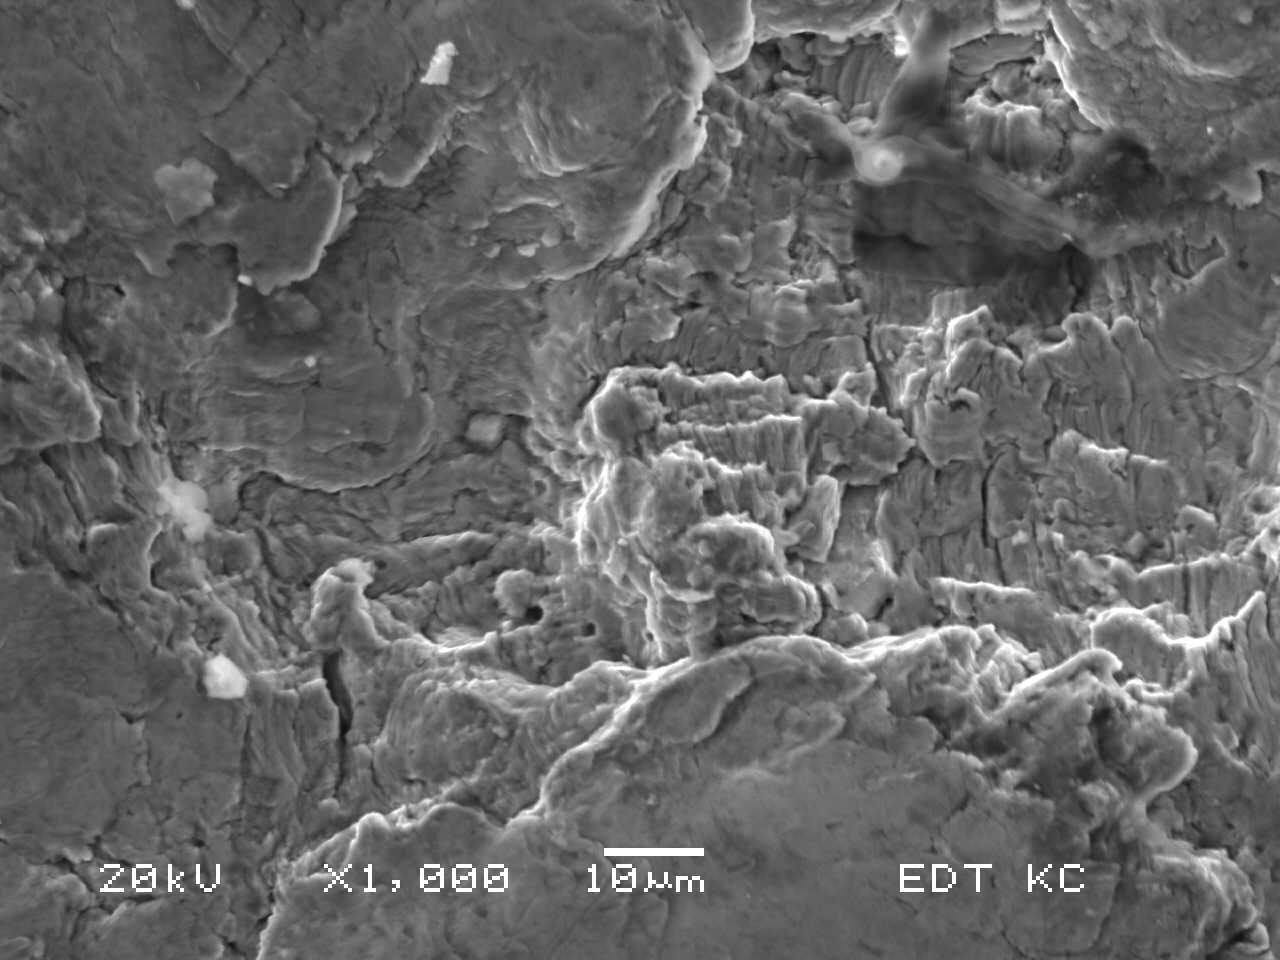
Examination of an unflattened/unaltered portion of the fracture surface at higher magnification (1000x) finds it to feature aligned striations, faintly observable at even this level of magnification. These aligned, microscopic striations are characteristic of fatigue fractures. A variation in the spacing of these striations can be an indication that changes in loading occurred during the progression of the fatigue failure, with an increase in spacing implying an increase in load, and vice versa.
Though many broken parts look similar at a glance, there is often more than meets the eye. In fact, with the use of advanced equipment and methods, much can be learned about a failed part after the fact.
In our next installment in this series, we’ll be discussing yet another form of fracture and how it can be distinguished from the fatigue and overload fractures we’ve discussed so far.
___________________________________